Tracking performance is essential to understand the factors driving the success of your influencer marketing program. It helps you to set clear goals, and KPIs that guide your efforts effectively.
To monitor your influencer program’s performance in SARAL, simply go to the Performance section in the left sidebar.
You can view performance metrics by “List” by filtering from the top left dropdown, or select “All” to get a comprehensive overview of your account across various lists and campaigns. Additionally, you can use the calendar in the top-right corner to adjust the time frame for your performance view.
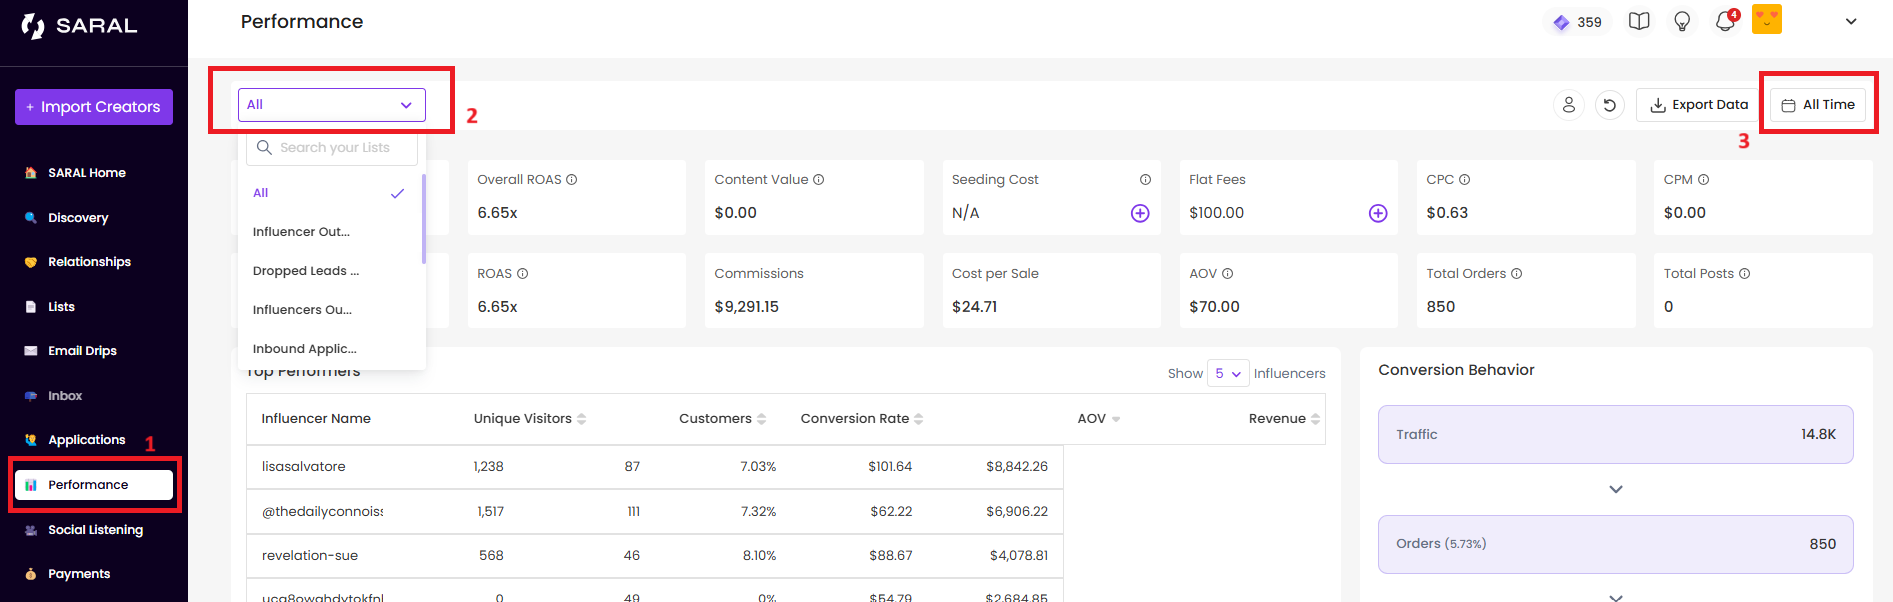
Here are some high-level overview metrics you will find:
Campaign Traffic under Unique Visitors
Revenue
Overall ROAS is your return on spend including the value of content you receive
ROAS
Content value: The total estimated value of fees you would pay to receive the UGC content from influencers (if you’re working on a commission basis only, without paying influencers flat fees for their produced content).
Seeding Cost: Your logged Cost Of Goods
Commissions: Total commission value paid out to influencers
Cost per Sales: Representing your influencer CAC
New customers: Total number of customers acquired through your influencer program.
Flat fees paid: The total flat fees logged into SARAL when collaborating with influencers on a flat fee or base fee + commission basis.
AOV (Average Order Value)
CPC (Cost-per-Click)
Total Orders: Customers acquired via influencers
Total posts received

The Top Performers chart highlights your most successful influencers based on key metrics like:
Unique Visitors
Sales
Conversion Rate (CVR)
Net Revenue
This data helps you:
Identify high-performing collaborations worth scaling.
Consider upgrading their commission tier or offering exclusive perks.
Explore new strategies such as monthly retainers or dedicated campaign content to boost engagement and drive even more results.

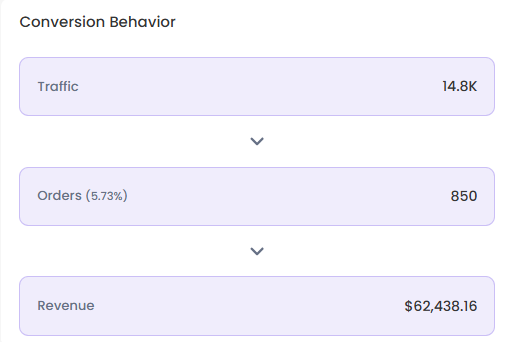
The conversion behavior funnel flow chart displays your total traffic-to-conversion CVR, calculating your overall campaign revenue for your selected time frame.
This card in your Performance view provides a detailed snapshot of your influencer program’s journey—from outreach to onboarding and post-onboarding content creation—within the selected date range.
It helps you:
Estimate conversion rates (CRVs) at each stage of the funnel
Compare your results against industry benchmarks
Gain insights into the effectiveness of your influencer funnel
Identify key opportunities for optimization
For the best insights, review your seeding funnel over an extended period to fully assess your campaign’s overall impact.
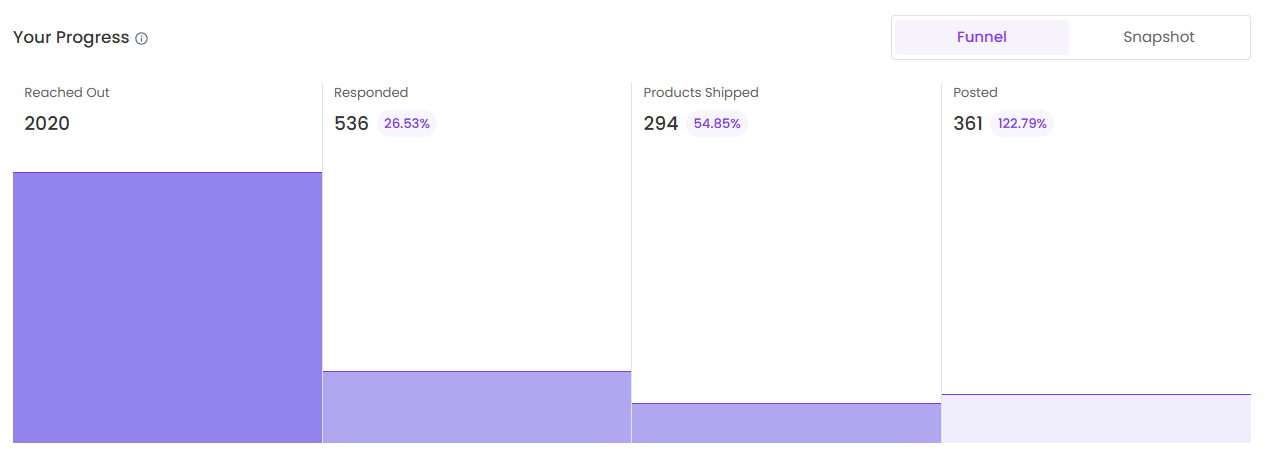
1 — Funnel View
This displays your conversion rates for key metrics:
Reached Out
Responded
Products Shipped
Posted
This helps you gauge how effective your product seeding campaigns are. For more details on how these metrics are calculated, visit here.
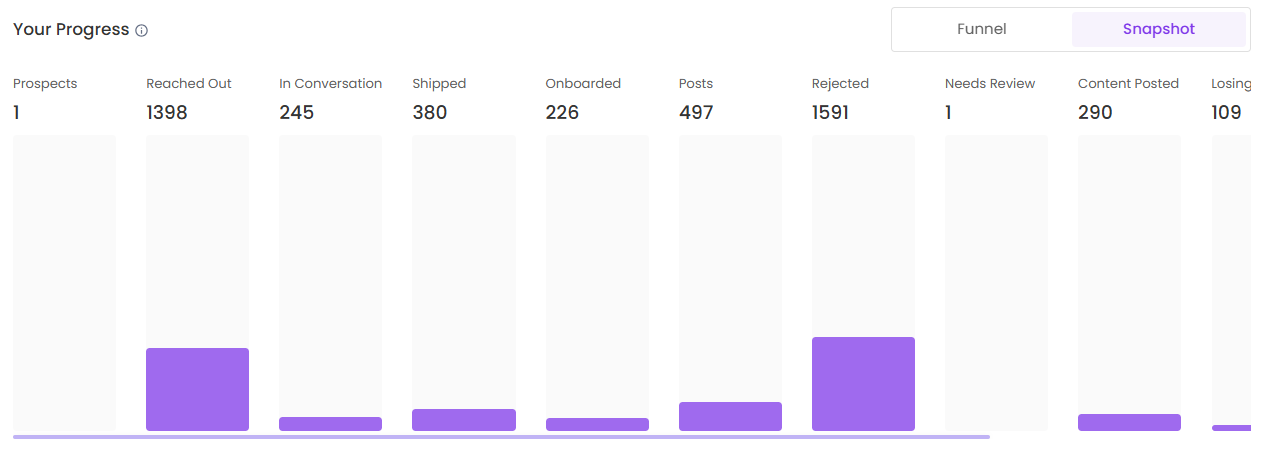
2 — Snapshot
The numbers displayed here represent your progress at each stage of your influencer relationships—the boards you’ve created.
This helps you quickly assess how your influencer relationships are performing and identify any areas that may need attention or improvement.
The People Reached metric estimates the total audience you can reach through your onboarded influencers. It’s calculated based on:
The number of influencers you’ve onboarded.
Their individual reach (total impressions on posts so far).
In other words, it represents the combined reach you can expect from all your onboarded influencers.

Reach out anytime with our helpful Support team using the button at the bottom-right corner of your dashboard, or email us at [email protected].