The Influencer Performance View helps you analyze the individual contribution of each influencer to your campaigns. You can find this by visiting any influencer's profile and navigating to the Performance tab on the top left. This section enables you to compare creators, optimize commissions, and guide future collaborations based on detailed metrics.
Looking for campaign-level or overall performance tracking? See our Performance Metrics Overview guide
These metrics reflect the direct business impact driven by an individual influencer:
Unique Visitors: Number of unique visitors brought to your store by the influencer.
Revenue: Total revenue (or sales) attributed to this influencer.
Orders: Number of total orders driven by the influencer.
Seeding Cost: The cost of products sent to the influencer as part of a seeding or gifting strategy.
ROAS: Return on ad spend, calculated as revenue divided by total costs (including flat fees, COGS, and commissions).
EPC (Earnings per Click): Total revenue divided by the number of clicks attributed to this influencer. This helps you track efficiency, as a higher EPC means the influencer's audience is buying more.
These metrics represent the reach, influence, and value of the influencer's content:
Impressions: The number of views the influencer's content received.
EMV (Earned Media Value): The value of the influencer’s organic exposure, based on industry-standard CPMs. You can customize this in settings.
CPE (Cost per Engagement): The average cost incurred for each engagement (like, comment, share) generated by the influencer's content.
Content Value: Estimated worth of the content created by the influencer (if you were to pay for it), useful for evaluating seeding campaigns.
Total Posts: Number of posts tracked for this influencer across all platforms.
This chart helps track revenue growth over time from a single influencer.
Total Revenue: Cumulative revenue attributed to the influencer.
Monthly Avg. Sales: Average monthly revenue generated from this influencer's campaigns.
New vs. Returning Customers: Breakdown of attributed revenue and commissions by customer type, showing how much revenue comes from new customers versus returning ones.
Understand how audiences are reacting to the influencer's content through AI-powered sentiment analysis:
Buying: Comments expressing product interest or purchase intent (e.g., "Where can I buy this?").
Neutral: General or aesthetic compliments unrelated to product (e.g., "Love your style!").
Negative: Negative feedback toward the brand or product (e.g., "This lotion triggered my acne").
Total Posts: Total content pieces tracked from this influencer.
Instagram / TikTok / YouTube: Platform-wise breakdown to assess consistency and coverage.
These metrics provide a 360-degree view of how each influencer is performing individually, and can help you:
Reallocate budgets to top performers
Identify underperforming creators
Structure commission tiers
Make strategic seeding decisions
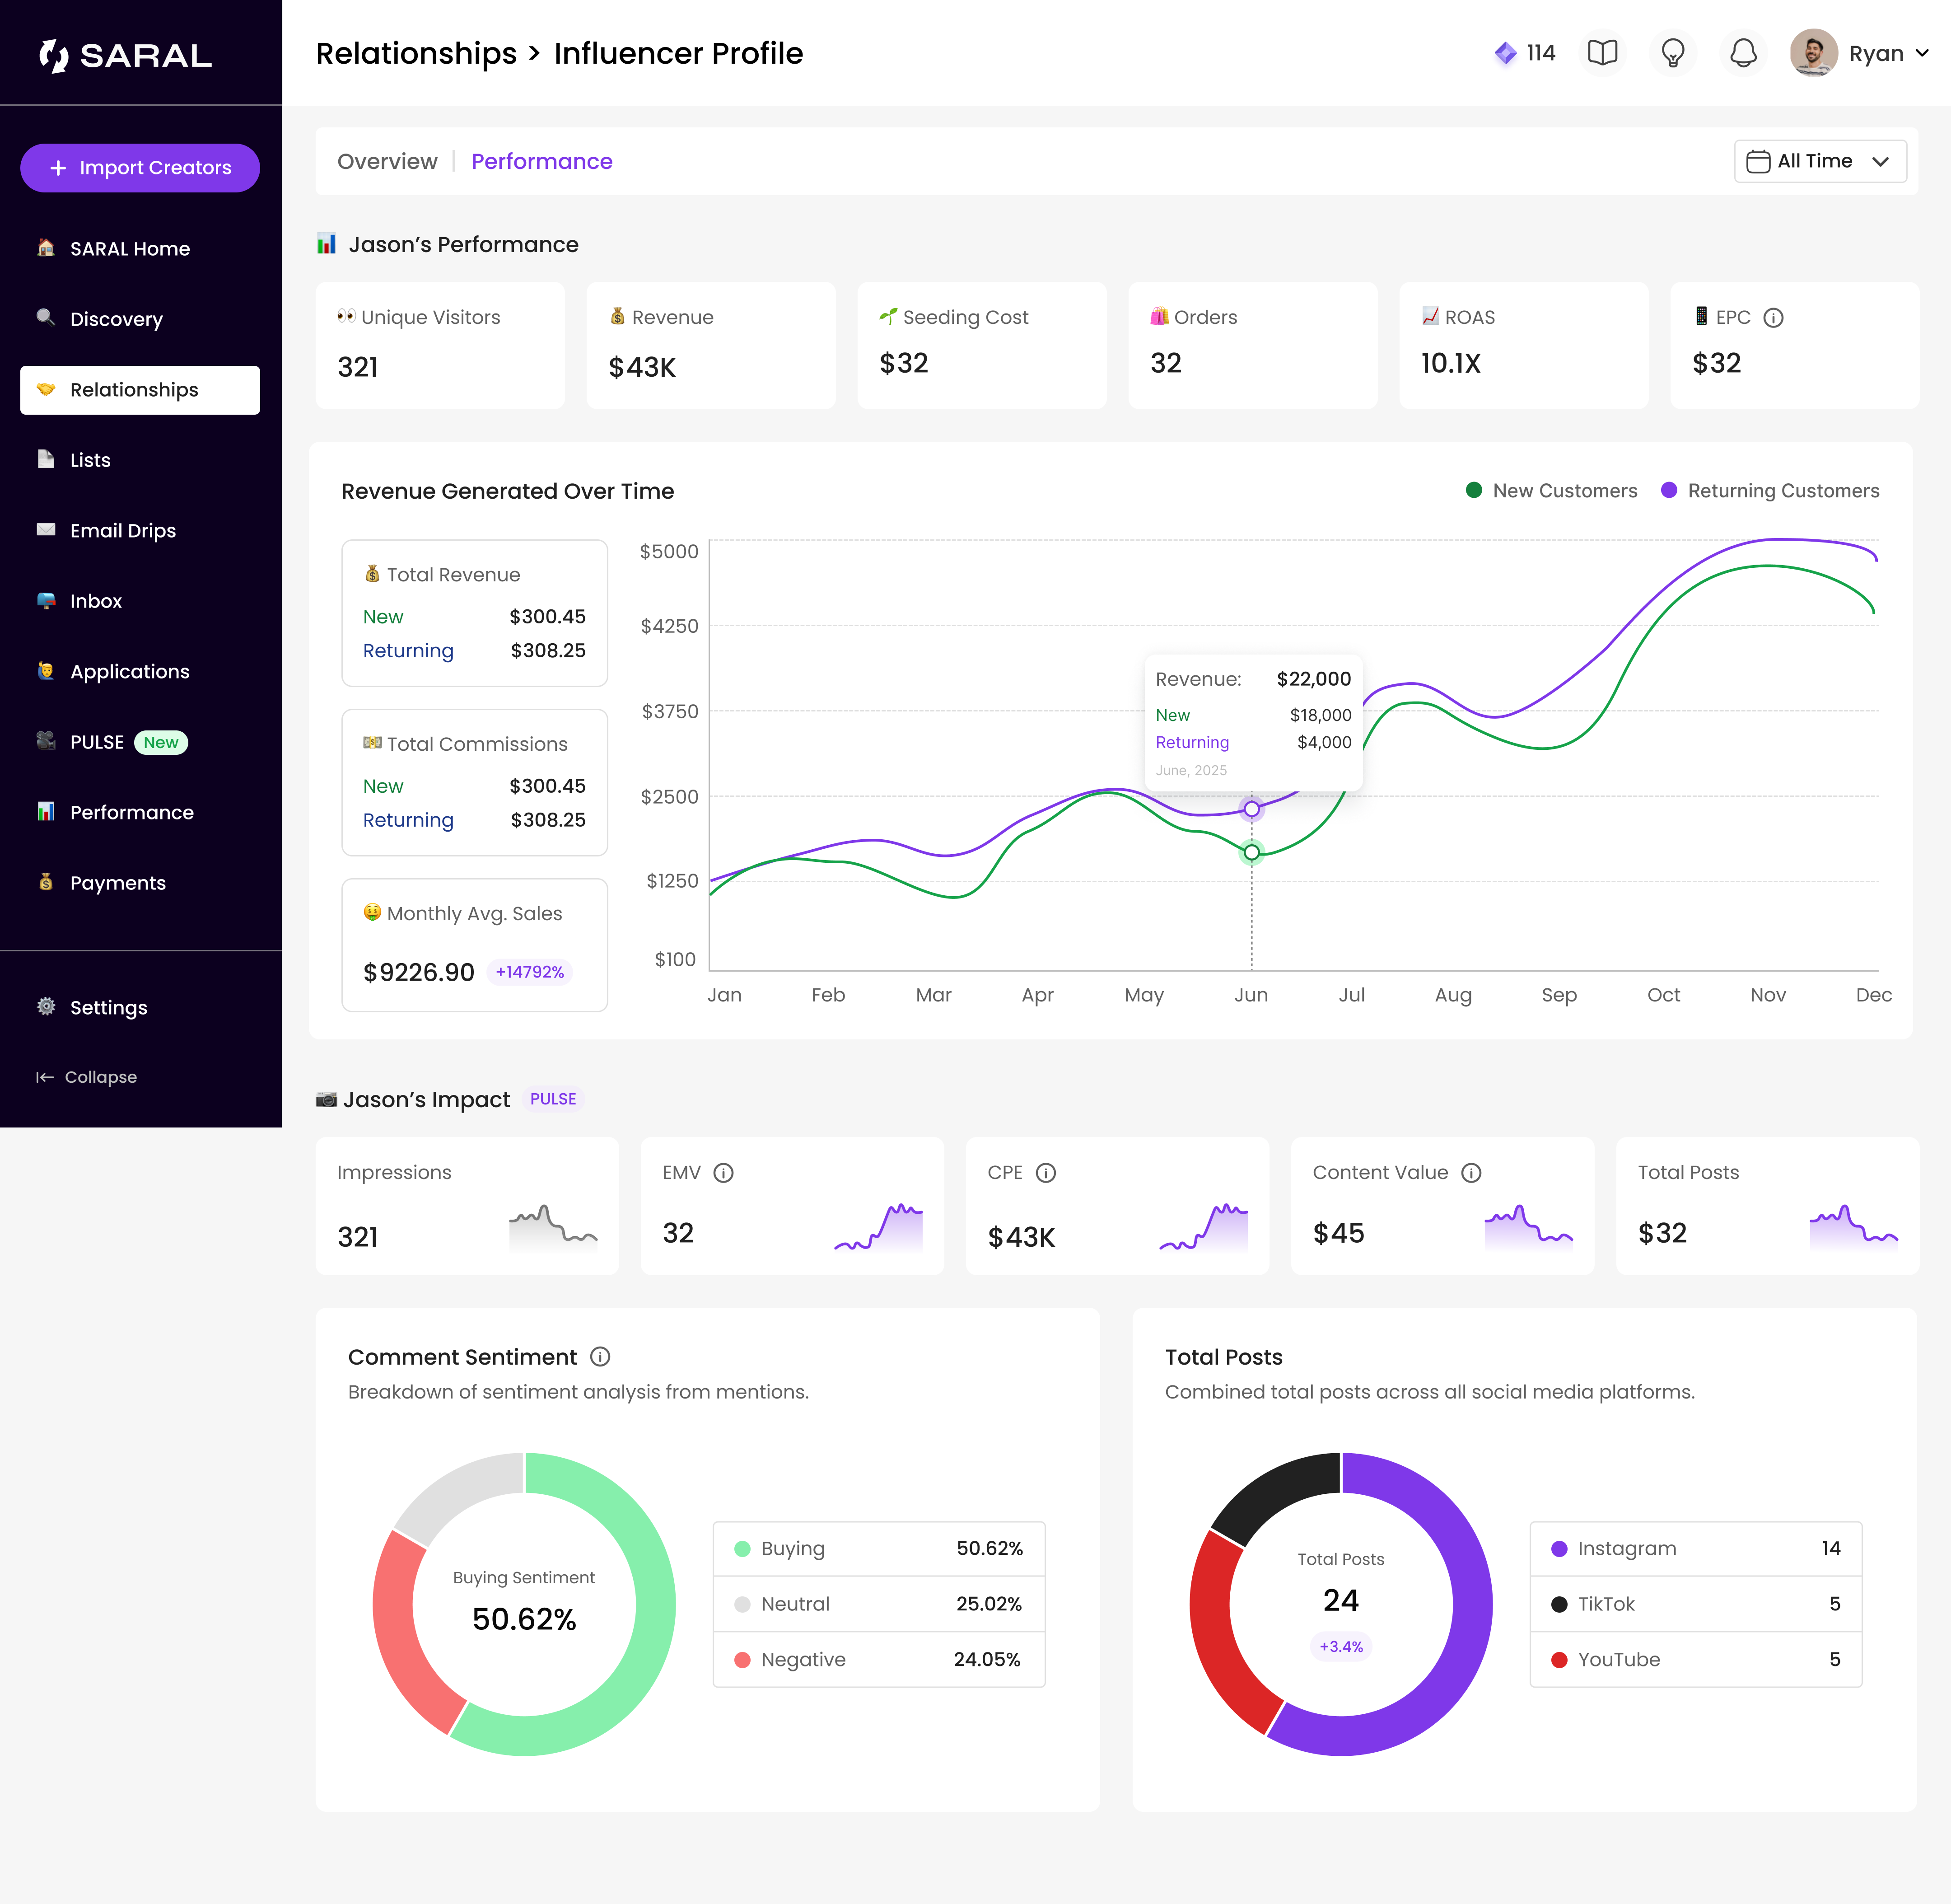
Here is how your ‘ Influencer Performance View’ will look like:
Reach out anytime with our helpful Support team using the button at the bottom-right corner of your dashboard, or email us at [email protected].